| |
Identification of active ligands among a set of inactive ones
The goal of a docking program is to predict the binding mode of a ligand to an active site of a given target-protein and to estimate corresponding value of a scoring function defining the protein-ligand binding free energy and the respective inhibition constant. The more negative values of the scoring function correspond to the stronger ligand binding to the target-protein. The main practical application of the docking program is determined by its ability to distinguish inactive ligands from the active inhibitors for a given target-protein with respect to values of their scoring function. In other words, active inhibitors must have lower (more negative) values of the scoring function than ones of inactive (or “rubbish”) ligands. The docking program must rank the whole set of docked ligands leading out active compounds with the more negative scoring function to the top of the list. The more active ligands (real inhibitors) are top-ranked, the more successful docking rate is, the better the docking program predicts new inhibitors.
To perform this type of validation it is necessary to pick out several target-proteins and to create a validation set of ligands for each target-protein. Each of these validation sets has to contain inactive (“rubbish”) compounds as well as real inhibitors with experimentally proved inhibition activity for the corresponding target-protein.
Four target-protein have been selected for our validation:
- Thrombin (from 1O2G PDB complex, resolution 1.58 A);
- p38 MAP Kinase (from 1A9U PDB complex, resolution 2.50 A);
- Factor Xa (from 1LQD PDB complex, resolution 2.70 A);
- Human estrogen receptor (from 1XPC PDB complex, resolution 1.60 A).
These target-proteins have been chosen due to existence of information about their structure, their inhibitors, and their practical importance.
To perform docking with our program SOL the preprocessing of proteins and respective ligands have been carried out. There were incomplete side chains and missing amino acid residues of selected proteins in the vicinity of the binding site. Missing protein hydrogen atoms have been added by Reduce program1. All water molecules, inhibitors and small ions like sulfates and phosphates have been removed from the complexes. Next, all protein atoms have been typified in accordance with the Merck Force Field (MMFF94)2-6 using our own procedure7. Docking area has been represented by a cube covering the protein active site with the edge 22 Å. The cube centre has been chosen as the geometrical centre of the native ligand of the respective PDB protein-ligand complex. As a result the protein structures have been saved to mrk files suitable for subsequent 101×101×101 grid generation.
The database NCI Diversity8 was selected as a set of inactive or “rubbish” ligands. Protonation states of 1894 compounds from the NCI Diversity were assigned according to acidity pH=7. The active ligands for thrombin, p38 MAP kinase and estrogen receptor were taken from Ref.9 in SMILES format. These compounds were transformed to 3D structures by Corina10. The subsets of active ligands for the respective target-proteins have been augmented also by inhibitors taken from the next references: thrombin11-20, p38 MAP kinase21, factor Xa22. For each target-protein the validation set of ligands has been constructed by combining total 1894 ligands (inactive ligands) and the respective active ligands (inhibitors): for thrombin – 25, p38 MAP Kinase - 26,for Factor Xa – 59, for Human estrogen receptor – 52.
The main result of this validation is four sets of ligands ranked by the docking program in accordance with their scoring function for the respective target-protein. Results for each of the four target-proteins are presented in the form of enrichment plots (E-plots). Top-scoring ligands are ligands with best scoring function which are ranked in the top of the list. The E-plot represents the number of real inhibitors (OY axis) found among a given number of top-scoring ligands (OX axis). Numbers along OY and OX axes are normalized by the total number of real inhibitors in the whole validation set and by the total number of all molecules in the validation set, respectively. For example, if 8 real inhibitors are presented among 2000 ligands of the validation set and 4 real inhibitors are found among 200 ligands taken from the top of the ranked list, then the corresponding point of the E-plot has coordinates (x=10, y=50) because x=200/2000 = 0.10 and y=4/8 = 0.50.,The quality of the top list enrichment by the real inhibitors usually is represented by the Enrichment Value (EV), which is calculated as the dimensionless area under the E-plot. EV is equal to 0.5 for the lack of enrichment and EV must be close to 1 for the case of the perfect enrichment (theoretical limit) when all real inhibitors are situated in the top of the ligands ranked list in succession. Enrichment value larger than 0.9 shows the excellent docking quality, EV between 0.7-0.9 represents the good quality and, finally, EV between 0.6-0.7 demonstrates satisfactory quality. The EV theoretical limit is calculated as the area under E-plot for the case when all real inhibitors from the respective validation set of ligands are ranked in the very top of the list, e.g. if the validation set contains 57 real inhibitors, all 57 top positions of the ranked list will be filled by them.
The E-plots for the four selected target-proteins are presented in Fig.1. The enrichment values and theoretical limits calculated for each target-protein are presented in Table 1.
Table 1. Enrichment values for the four targeted proteins
Protein name |
Enrichment value
(EV) |
Theoretical limit of Enrichment value |
Factor Xa |
0.939988 |
0.984887 |
p38 MAP kinase |
0.637652 |
0.993226 |
Estrogen receptor |
0.954927 |
0.986814 |
Thrombin |
0.788898 |
0.993473 |
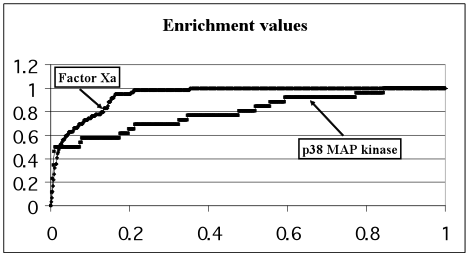
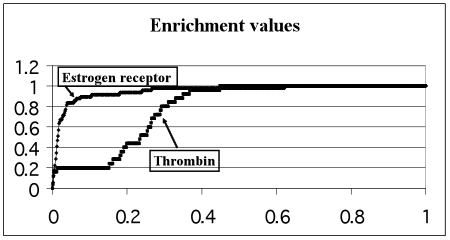
Figure 1. Enrichment plots for each of the 4 proteins under consideration. Relative number of real inhibitors (OY axis) as a function of the relative number of top-scoring ligands containing those real inhibitors (OX axis)
The EV for p38 MAP kinase being in the range 0.6-0.7 demonstrates satisfactory docking quality. The EV for Thrombin is in the range 0.7-0.9 and demonstrates good docking quality. The docking quality of the rest 2 proteins (Factor Xa and Estrogen receptor) is excellent because their enrichment values are larger than 0.9.
However, it should be noted that some ligands from NCI Diversity database may also be real inhibitors in addition to the known inhibitors, i.e. it was not proved experimentally that all these compounds were inactive for four our target-proteins. Moreover, it have been proved23,24 that some of them are real inhibitors, e.g. for thrombin. That is why the calculated enrichment values may underestimate the ability of SOL scoring function to give better scores for real inhibitors than scores for inactive compounds. Combining a subset of 1000 ligands with the worst scoring function values as “rubbish” for thrombin with the same 25 real inhibitors (these 25 real inhibitors were presented in the validation set used for the construction of the E-plot in Fig.1 for thrombin) we obtained the enrichment value equal to 0.986. This value differs drastically from EV=0.788898 (Table 1) obtained for the whole validation set (1894 inactive and 25 real inhibitors) and demonstrates the excellent docking quality of SOL program.
|
|